Project leader: Prof. Dr. Marius Kloft (Department of Computer Science)
Staff:
- Philipp Liznerski
In AVATARS, one of the major aims is to predict seed properties with a multi-modal deep learning model that is able to process the heterogeneous data modalities collected in AVATARS. At the beginning of the project, we focus on high throughput data such as the hyperspectral and CT data that is going to be generated in deep phenotyping experiments, as we find that these are the most promising types of data containing rich high-dimensional information. The data is stored and managed by the IPK and NPZi developed AVATARS data hub, which provides access to structured data and meta data via SQL or RESTful services in conjunction with an online accessible file system for binary data. In order to feature on-premise compute, local deployable data containers are compiled on demand.
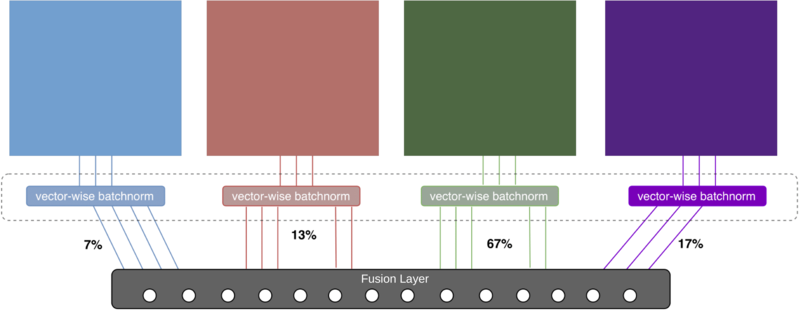
For a deep machine learning model, it is hard to learn how to deal with completely different data modalities. We have to develop a deep learning architecture that is able to perform a deep integration of data sources. As a starting point, we use our own prior work, which was done in the project „DeepIntegrate" in cooperation with NPZi. For each modality, this architecture requires a specifically crafted subnetwork, whose features are used in a final fusion layer for prediction (see Figure 1). In AVATARS, we developed an unsupervised-learning based approach that detects anomalies in images [1]. While the features that are learned during this process are useful for our multi-modal setup, the method itself can also be independently applied to CT scans of rapeseeds, as it can be readily extended to three-dimensional data. Our algorithm can be used to detect anomalous seeds (i.e., seeds that are going to germinate abnormally) or dead seeds (i.e., seeds that are not going to germinate at all). Additionally, we designed our algorithms to be explainable. So, instead of it behaving like a black box that predicts an output without justification, it explains its decision by providing anomaly heatmaps that are marking the regions in the input that the network deems to be anomalous.
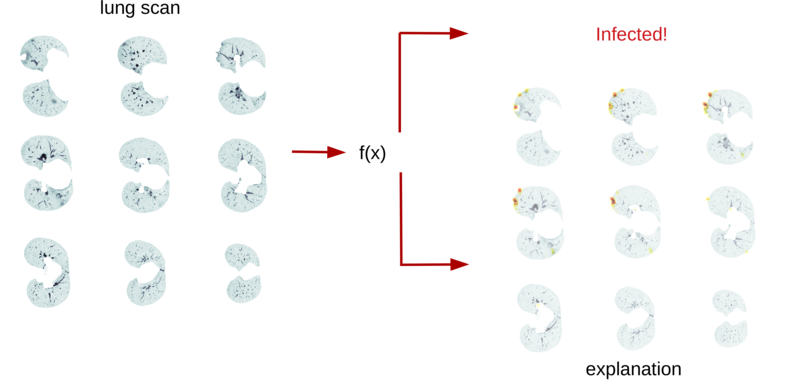
Since the CT scans in AVATARS are ongoing, we have instead tested our approach on a freely available dataset of CT scans of lungs, where the aim is to distinguish between lungs of persons that are healthy or infected by Covid-19. Some first experiments yielded promising results with an AUC (Area Under the ROC curve) score of roughly 90%, which is a score rating the performance of anomaly detectors. Figure 2 shows an example of an input scan and corresponding anomaly heatmap. In a next step, we will apply our algorithm to the soon-to-be available AVATARS rapeseed scans to predict germination capabilities.
Publications
Anomaly detection, such as deep one-class classification, utilize a mapping that concentrates nominal samples in feature space while pushing anomalies away. However, interpreting this non-linear transformation poses a challenge. To address this, the Fully Convolutional Data Description (FCDD) method is introduced in this paper. FCDD not only achieves competitive detection performance but also provides explanation heatmaps using the mapped samples. It demonstrates success on benchmark datasets like CIFAR-10, ImageNet, and MVTec-AD, even outperforming existing methods in the unsupervised setting when incorporating ground-truth anomaly maps. Furthermore, FCDD's explanations shed light on the vulnerability of deep one-class classification models to spurious image features like watermarks.
Liznerski, P., Ruff, L., Vandermeulen, R. A., Franks, B. J., Kloft, M., & Müller, K.-R. (2020). Explainable Deep One-Class Classification (Version 3). arXiv. https://doi.org/10.48550/ARXIV.2007.01760
Anomaly detection (AD) has typically been treated as an unsupervised problem, relying solely on normal samples. However, recent findings demonstrate that utilizing large collections of random images, known as Outlier Exposure, significantly improves unsupervised image AD. Surprisingly, this study reveals that specialized AD learning methods may not be necessary for achieving state-of-the-art performance. Even a small collection of Outlier Exposure data, or just a single well-chosen outlier sample, can outperform existing approaches on established benchmarks like ImageNet. Additionally, using representations learned by CLIP, a cutting-edge foundation model, achieves impressive AD results on CIFAR-10 and ImageNet without any training samples in a zero-shot setting.
Liznerski, P., Ruff, L., Vandermeulen, R. A., Franks, B. J., Müller, K.-R., & Kloft, M. (2022). Exposing Outlier Exposure: What Can Be Learned From Few, One, and Zero Outlier Images (Version 2). arXiv. https://doi.org/10.48550/ARXIV.2205.11474